Most seasonality is noise.
Use Bullish Trade anywhere
Keep the same portfolio-strength workflow on desktop, mobile, and web. Choose the setup that fits how you invest.



Why use this Bullish Trade workflow
See the pattern and its consistency at the same time — not the one year someone remembers.
A pattern that looks clean recently might disappear over a longer lens. Check both before acting.
If the whole sector does it, it’s not a company-specific advantage. That’s not alpha — it’s baseline movement.
One good month is not a pattern
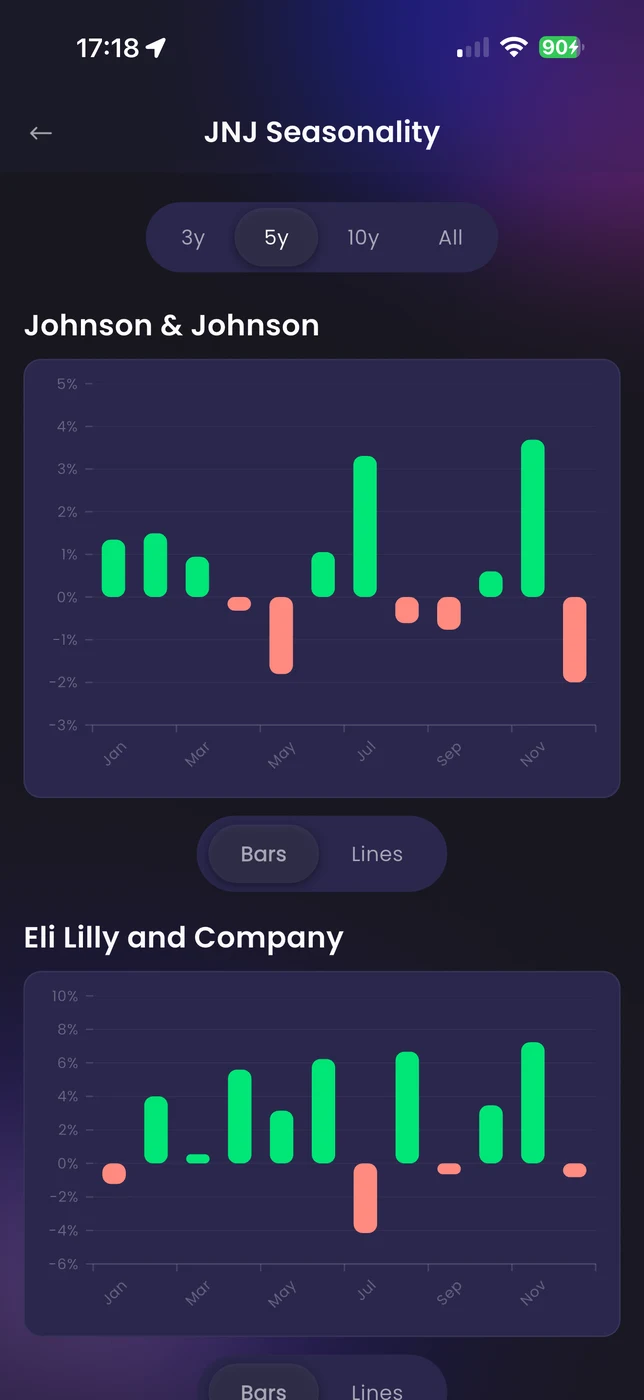
The seasonality chart tracks average percentage change from the first trading day of each year, grouped across historical periods.
That gives you a picture of consistent behavior — not the outlier year that got turned into a rule.
When the pattern is genuinely consistent, it shows clearly. When it isn't — when the chart shows randomness — that's useful information too.

Check if the pattern survives reality
Market regimes change. A seasonal tendency that worked in the past three years might not hold over a wider sample. The period selector exists so you can check — not assume.
3-year, 5-year, 10-year, and all-time views let you see whether the tendency is persistent or just recent. If it disappears when you widen the lens, weight it accordingly.
A visible trend isn’t enough. Cross-check across timeframes and peers to determine whether the behavior is consistent, regime-dependent, or breaking down.
Sector trend or real stock edge?
Seasonal patterns that apply to an entire industry are background noise for stock picking. What matters is when a company shows a meaningfully different tendency from its peers.
See whether the tendency is company-specific or just how the whole sector behaves. If peers show the same pattern, you're trading a market dynamic — not a stock edge.
A pattern shared across the industry isn’t an edge. It’s baseline behavior. Put it against competitors. If peers show the same move, you’re trading the market — not the company.
Seasonality informs — it doesn't decide
The best use of seasonality is to inform patience and timing, not to trigger automatic trades. Knowing a stock has historically struggled in October doesn't tell you to sell — it tells you to think carefully before sizing up.
When there's no reliable pattern at all, the chart shows that too. That's a useful answer: seasonality isn't a factor here, move on.
A seasonal window means look harder
Strong seasonality should prompt deeper research — not automatic action. Combine it with fundamentals, valuation, and portfolio fit before you do anything.
Seasonality belongs inside a broader workflow. On its own it's interesting. Combined with context it becomes useful.
From screens to clearer decisions
Pick the stock, choose how far back to look, compare with peers, and use what you find to improve your timing — or confirm that seasonality isn't a factor for this name.
Start with the stock you're already thinking about and pull its historical seasonality.
Move between 3y, 5y, 10y, and all-time to see whether the pattern survives a wider lens.
Put the stock next to competitors — company-specific tendency or sector-wide behavior?
Let strong, consistent patterns inform timing. Discard weak or noisy ones instead of forcing a conclusion.
Seasonality — common questions
How the tool works, what it can tell you, and where its limits are.
The chart groups historical price data by calendar year and tracks average percentage change from the first trading day of each year, making annual paths comparable across different sample lengths.
3-year, 5-year, 10-year, and all-time views. Switch between them to test whether the pattern is persistent or just a recent phenomenon.
The app pulls competitors from the same sector or industry as the main ticker, with fallback to liquid alternatives when direct peers aren't available.
No. A strong seasonal tendency with a weak business or an overvalued price is still a bad trade. Seasonality is timing context — company research, valuation, and portfolio fit should drive the underlying decision.