Understand what to buy. Understand what you own.
Why investors use Bullish Trade
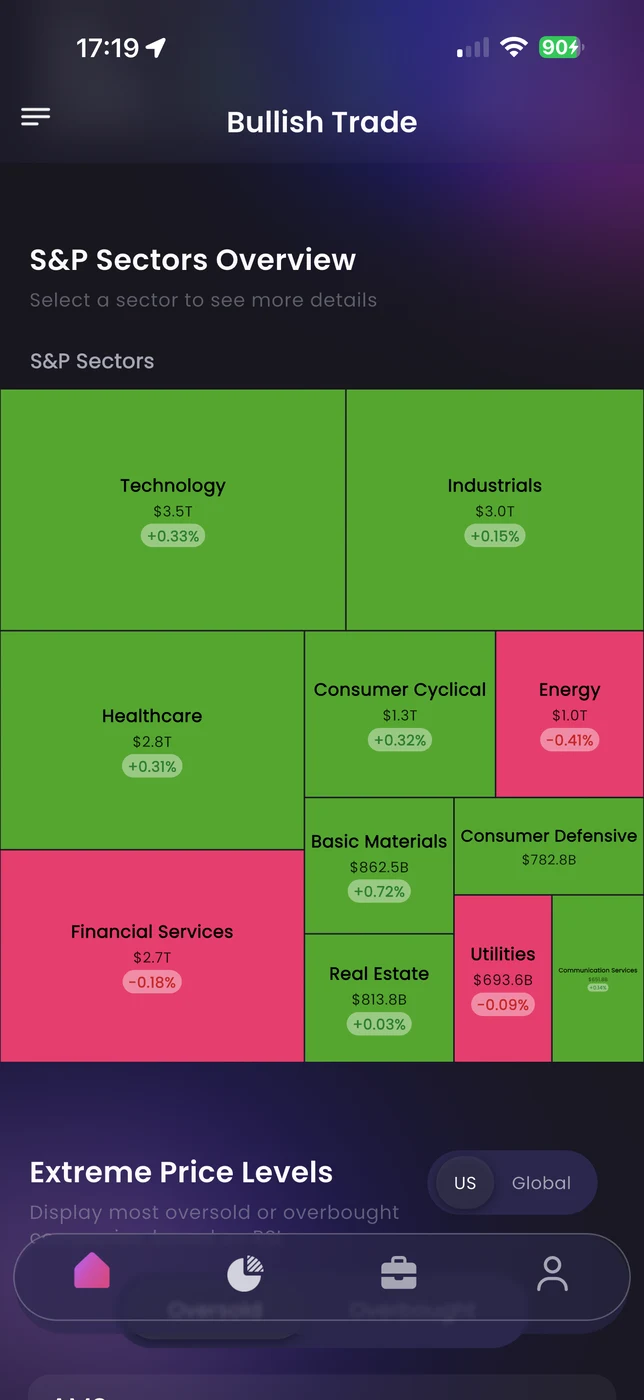
Market screeners, historical patterns, seasonality, and real insider and congressional trades — all pointing at what's worth a closer look.
Valuation, growth, earnings, cash flow, balance sheet — seven research dimensions per stock. Full holdings and overlap for every ETF.
True look-through exposure, hidden concentration, sector and country tilt, and clear flags on what deserves attention.
Use Bullish Trade anywhere
Keep the same portfolio-strength workflow on desktop, mobile, and web. Choose the setup that fits how you invest.


One screen instead of twelve tabs
Replace your yahoo finance, koyfin, finviz and your portfolio spreadsheets with Bullish Trade.
- Research companies across valuation, growth, earnings, balance sheet, cash flow, insider and congressional trades.
- Scan ETFs by fee, AUM, overlap, and exposure — including EU UCITS.
- Track your portfolio's true exposure across every layer.
- Find options trades worth taking with ranked results.
No tabs. No spreadsheets. No guessing.
Investors don't lack data. They lack direction.
One platform to take you from question to decision:
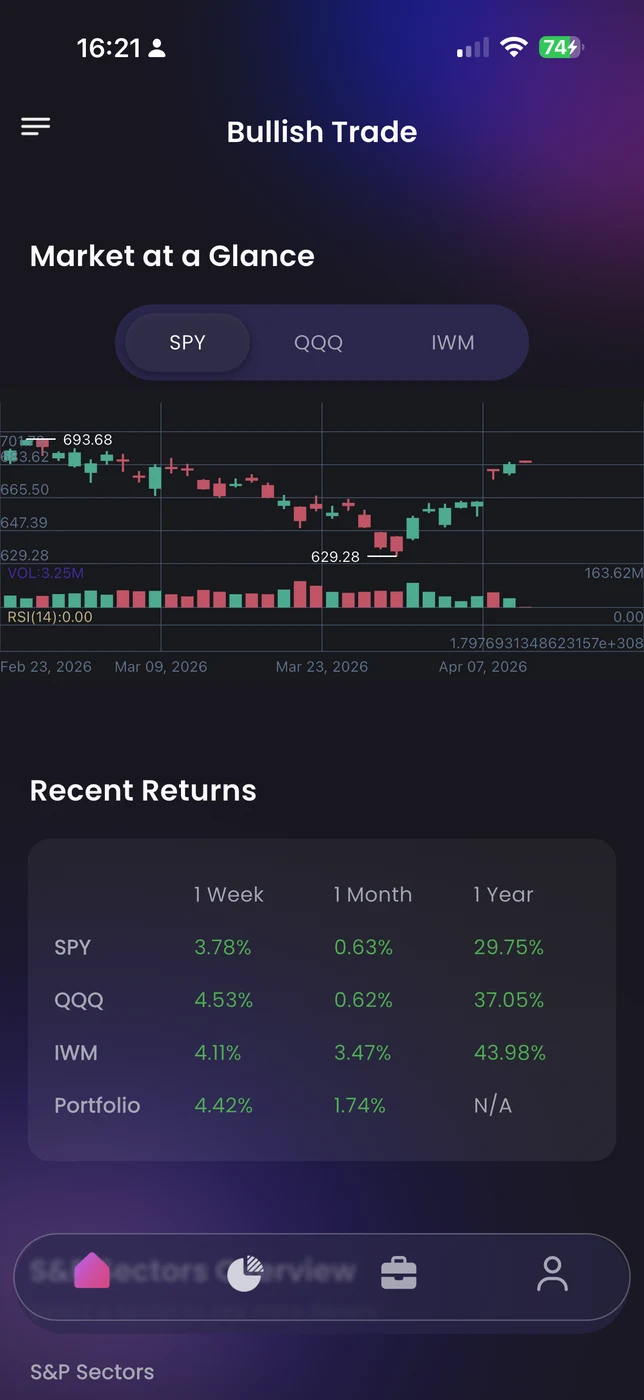
Market screeners, unusual volume, insider flow, patterns, seasonality.
Valuation, growth, earnings quality, balance sheet, cash flow — in one screen.
ETF look-through, overlap analysis, sector and country exposure.
Options scanner, trade setups, portfolio clarity — clear next steps.
From idea to conviction
When something catches your attention, go deep without switching tools.
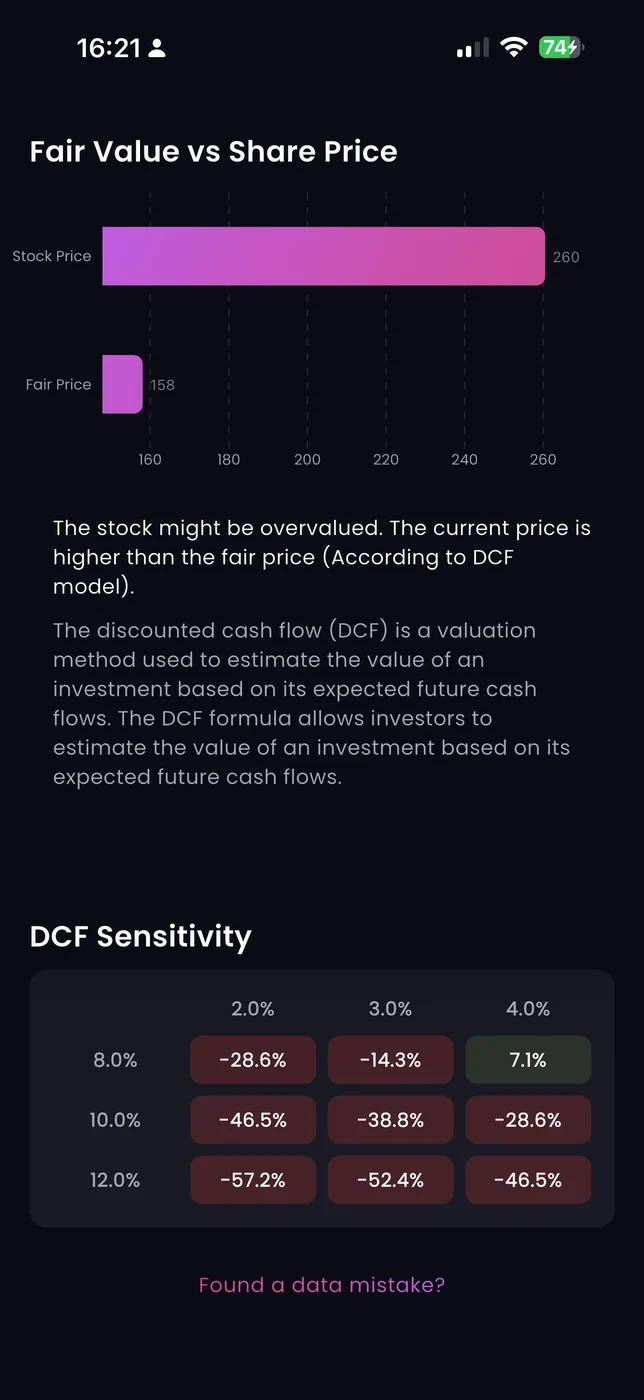
See how the stock is valued today versus its own history, versus peers, and versus the broader market. Spot what the price is actually pricing in.
See if the business is actually strong — or just looks good on the surface.
Find out how much debt the company carries, how much cash it generates, and whether it can sustain itself — especially in a downturn.
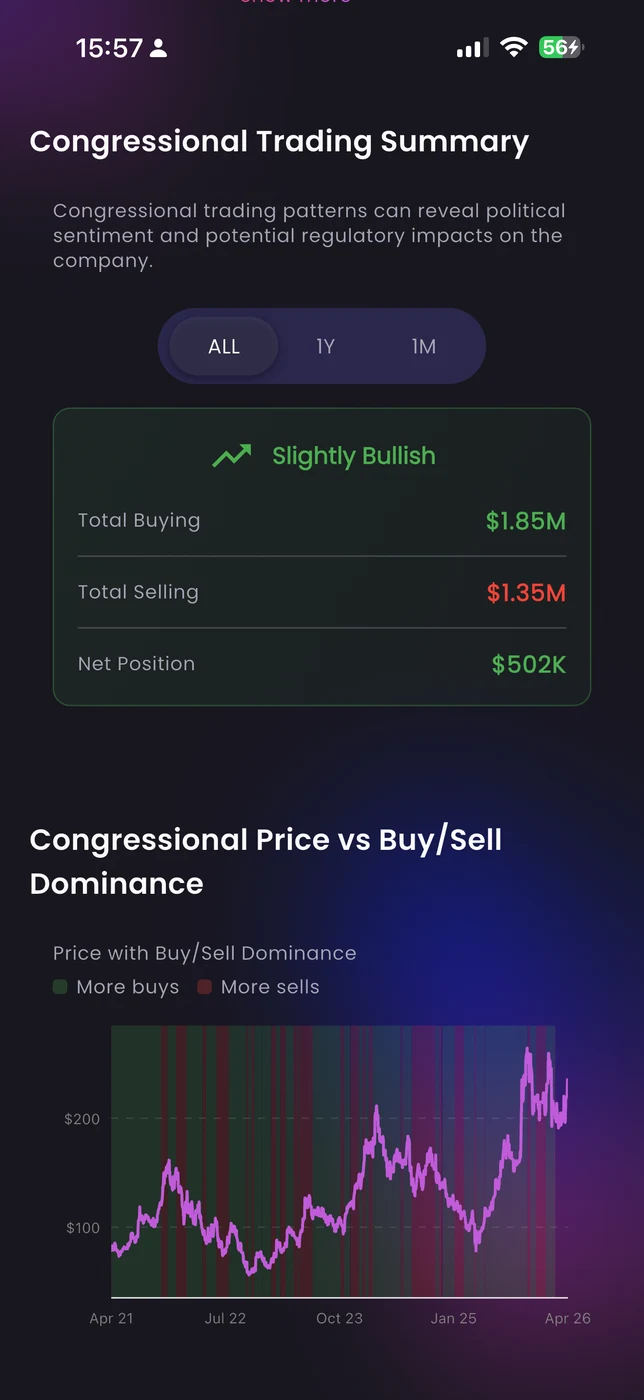
See whether executives and politicians are buying or selling — and whether that activity is a signal or just routine.
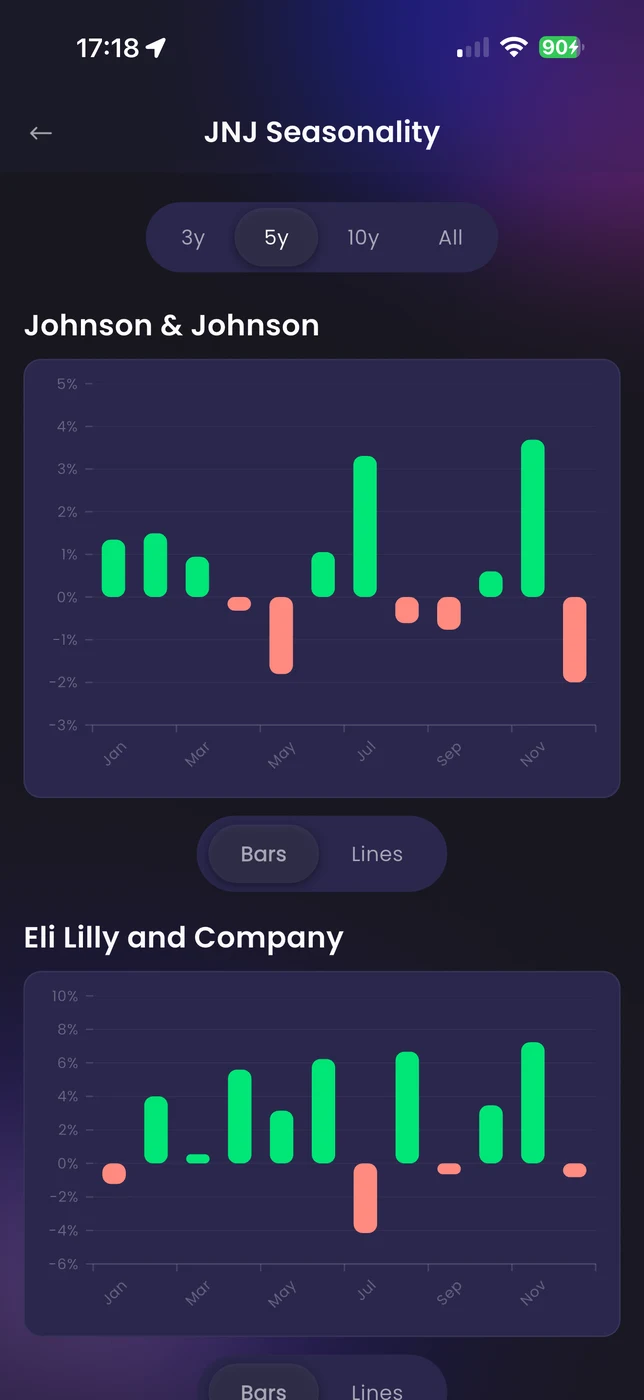
Plus seasonality, historical pattern matching, and dividend analysis for income investors.
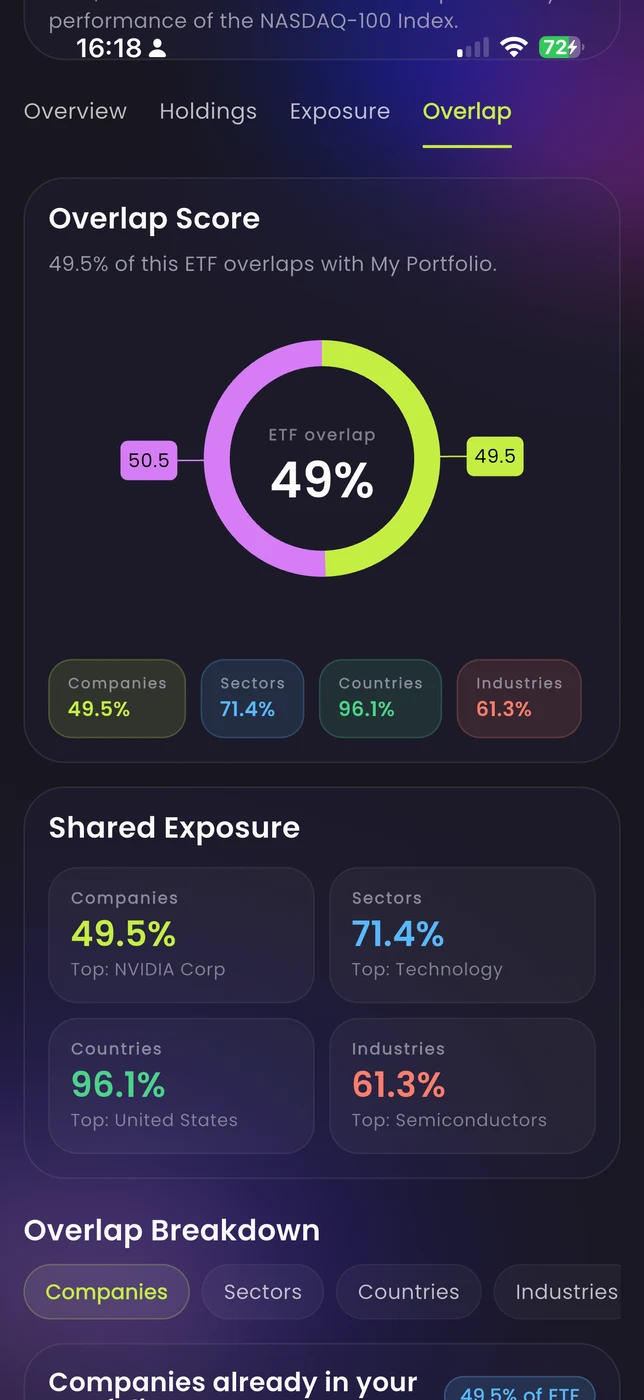
Most portfolios look diversified — until you look deeper.
ETFs hide hundreds of positions. Buy three funds and you might own the same 20 stocks three times over, concentrated in one sector, in one country, at stretched valuations.
- Look through every ETF layer to see your true company-level exposure.
- Find hidden concentration, sector imbalances, and country tilts.
- See the valuation mix across everything you hold. Anything extremely overvalued?
- Get plain-language flags on what might need attention — and confirmation when the portfolio already looks balanced.
Look inside funds before you buy them.
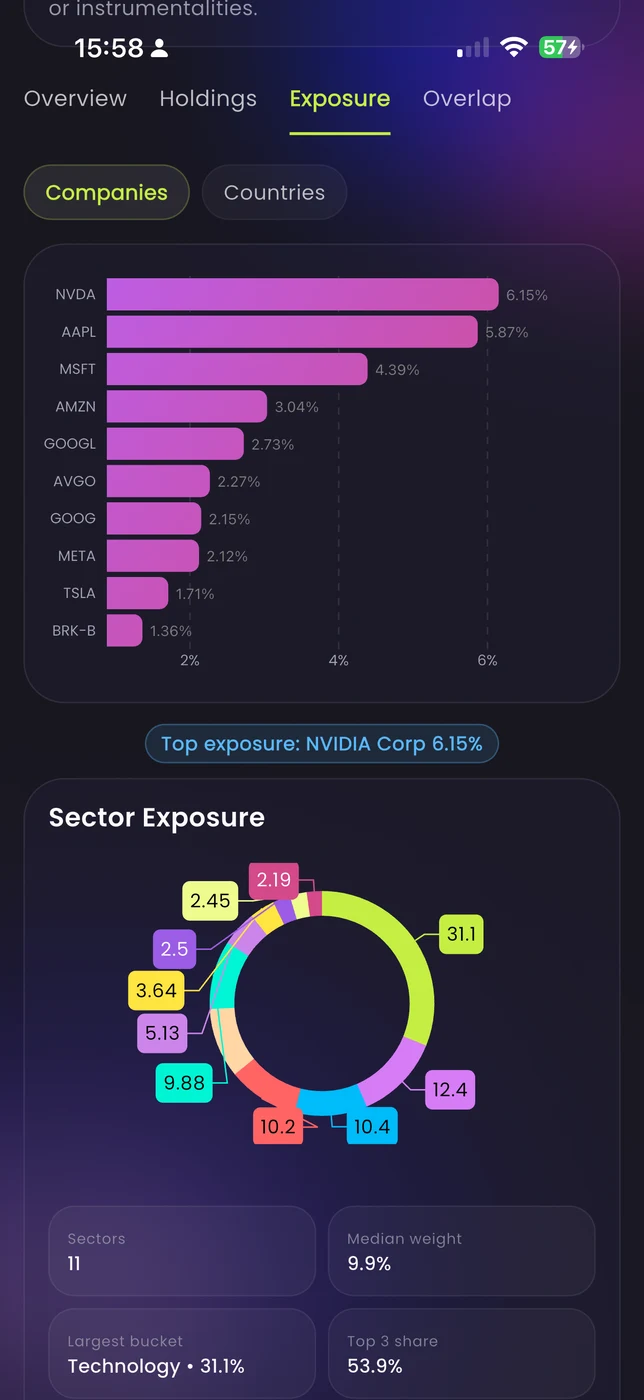
ETF research that goes beyond the label. See actual holdings, real overlap, and what the fund does to your existing portfolio.
- Full holdings list with weights, valuations, and sector breakdowns.
- Compare any ETF against your portfolio: company, sector, and country overlap side by side.
- Covers US-listed funds and EU UCITS — including low-cost accumulating ETFs.
- Filter by fee, AUM, asset class, domicile, overlap score, and valuation tilt.
Built for investors and traders.
Research and long-term portfolio tools sit alongside active trading tools — because most people do both.
See what senators and insiders trade. Explore their portfolios and position sizing.
Find historical setups similar to today's chart. See what happened next, with bullish and bearish breakdowns.
Month-by-month historical tendencies for any stock, across 3, 5, 10, or all available years.
Options scanner across multiple strategies. Filter, rank, and act.
From idea to conviction to action.
Scan markets, patterns, and real trades to discover what's worth a closer look.
Valuation, earnings, balance sheet, and cash flow — in one screen, not five tabs.
ETF look-through, portfolio overlap, sector and country exposure — no guessing.
Options scanner, trade setups, portfolio flags — make the next move with context.