Know what you actually own
Use Bullish Trade anywhere
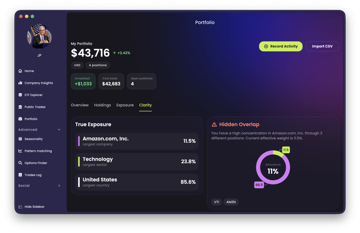
Keep the same portfolio-strength workflow on desktop, mobile, and web. Choose the setup that fits how you invest.


Why use this Bullish Trade workflow
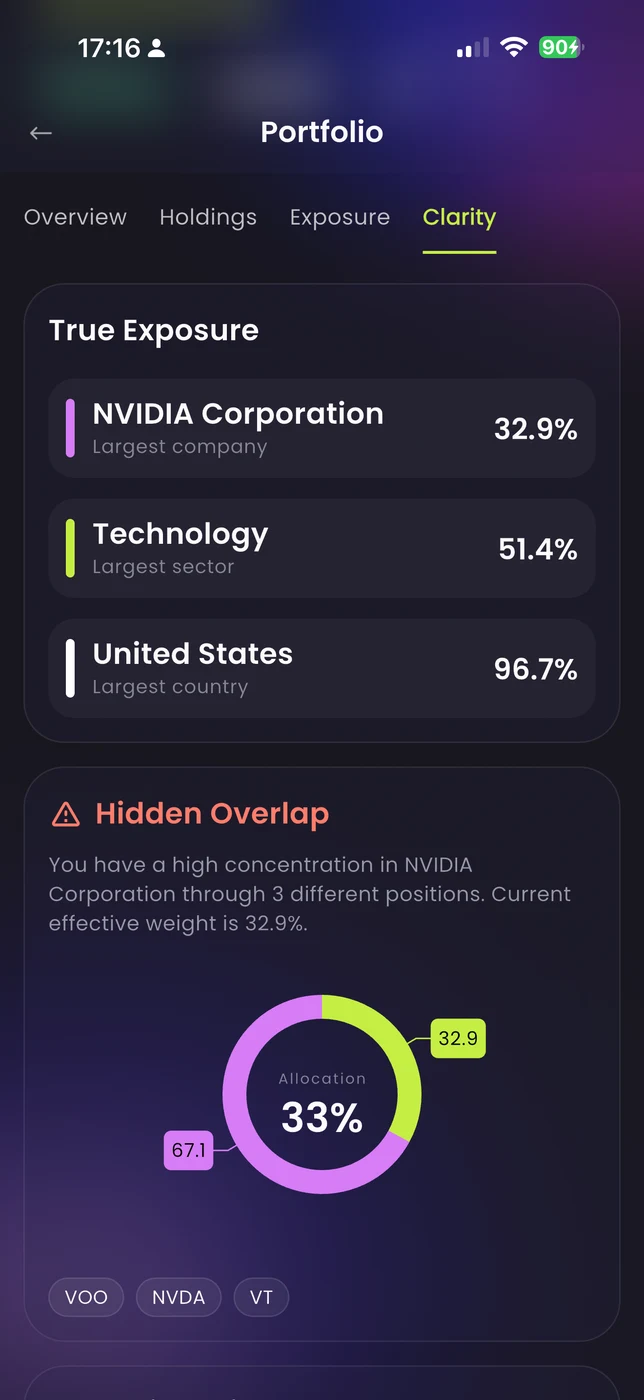
We show what you actually own underneath every ETF — companies, sectors, countries, industries.
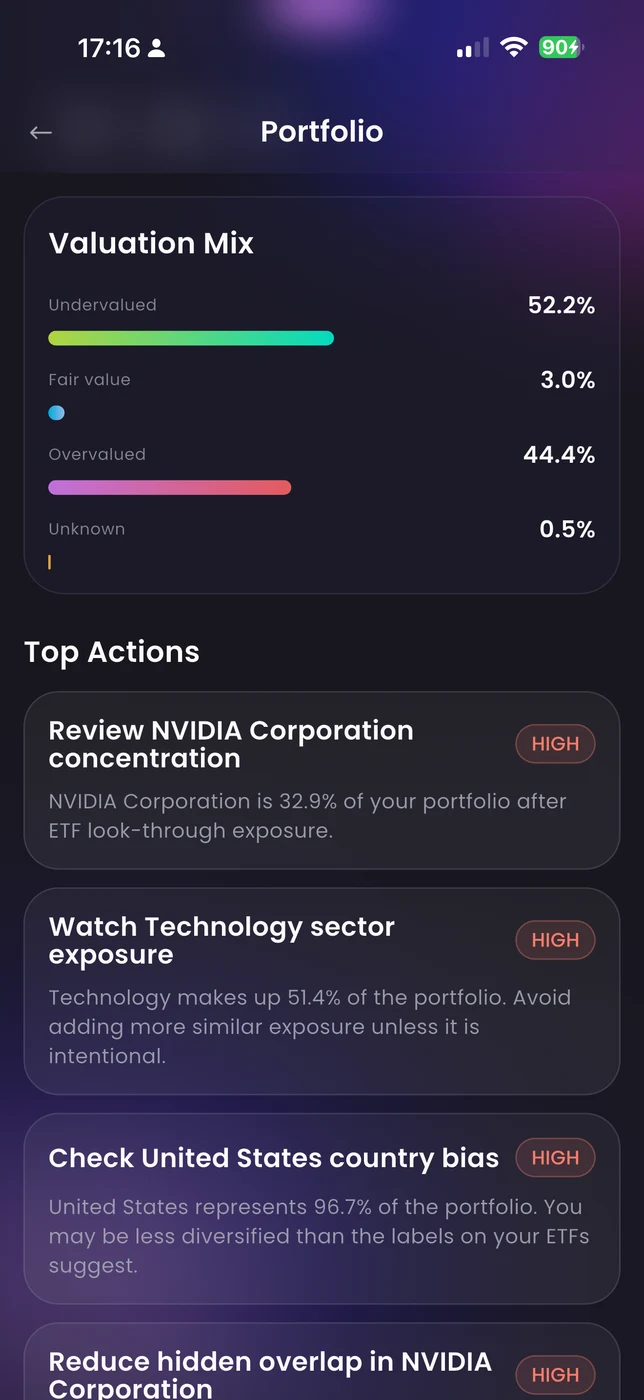
Hidden overlap, crowded sectors, and valuation skews surface before they become losses.
Clear confirmation when your portfolio is already balanced — no manufactured urgency.
Tracking without the risk blindspot
Most apps give you P/L and cost basis but stop before the hard question: is the risk profile actually sound?
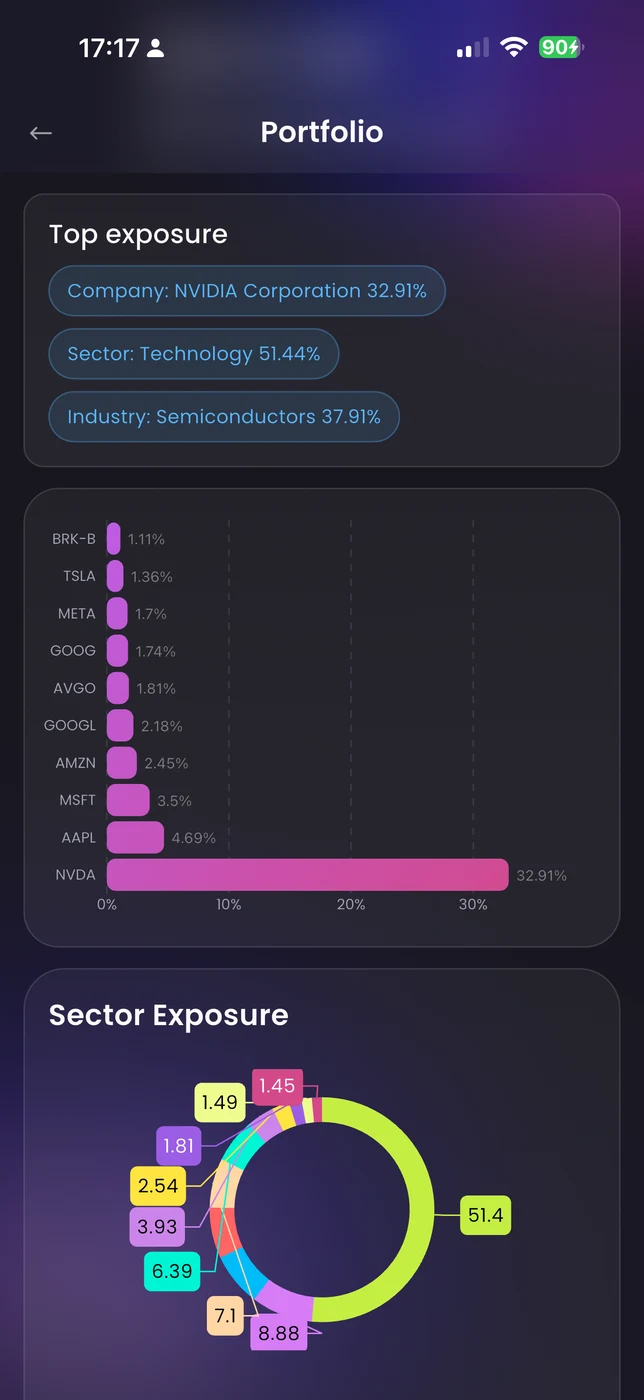
We look through every ETF and layer to show your true company-level exposure, hidden concentration across funds, sector and country imbalances. Not percentages — actual risk.
Add positions, import CSV, manage trades — without splitting tools. But more importantly: every position updates your real exposure instantly.
Your ETFs hide what you own
Fund tickers are just wrappers. The real exposure — companies, sectors, countries, industries — lives underneath. Most tools stop at the wrapper.
Break every ETF into underlying positions weighted by your position size. Learn where your money are concentrated.
Discover when multiple funds quietly double up on the same bets.
Dangerous portfolios that look fine
A well-constructed portfolio and a risky one can look identical on the surface. The difference is in what's underneath.
- True exposure across companies, sectors, countries, and industries
- Concentration that builds across multiple ETFs
- Valuation mix and hidden positions buried inside funds
- Clear next steps — or clear confirmation to do nothing
Add ETFs that improve your mix
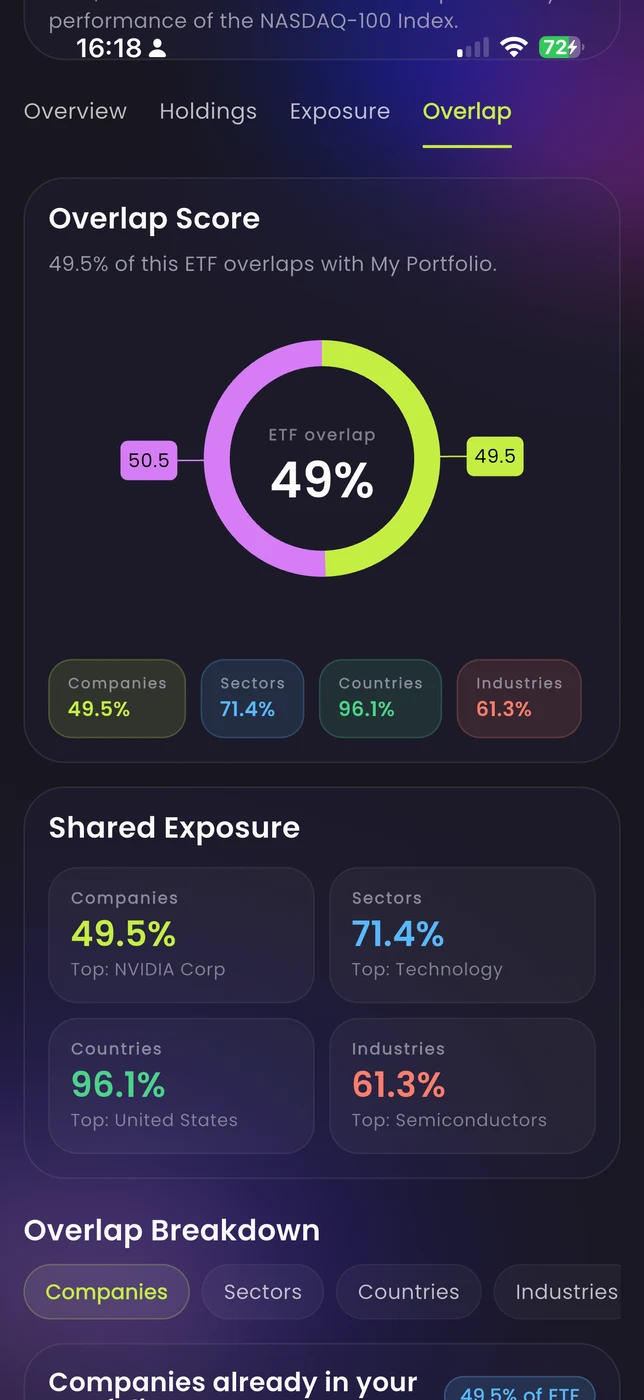
A cheap ETF can quietly add more of what you already own. A fee comparison won't catch that.
Filter by overlap score, valuation tilt, sector and country exposure — so your shortlist starts with funds that might actually help.
Compare any ETF against your portfolio across companies, sectors, countries, and industries.
Justify or cut your biggest risks
When one position drives most of your risk, you need to know if the business deserves the weight.
Valuation, growth, earnings quality, balance sheet, cash flow, dividends, and insider activity — all inside the same portfolio workflow.
From transactions to better decisions
Add what you own, look through every wrapper, and focus on the exposures that actually matter.
Manual entries or CSV import. Get the full picture in place first.
Break every ETF into real positions — companies, sectors, countries, industries.
Use clarity views to surface overlap, concentration, and valuation imbalances.
Rebalance, trim, or add with a clear view — or confirm it's already balanced.
Portfolio analysis — common questions
The questions worth answering before you trust a new tool with your portfolio.
A regular tracker shows cost basis, P/L, and performance. Bullish Trade also looks through ETF wrappers to show true underlying exposure and flags concentration and valuation issues a simple tracker won't catch.
Yes. The portfolio workflow handles both in the same view — manual entry, CSV import, editable transactions, benchmark comparison, and full look-through analysis.
Then we'll tell you that. Clarity views confirm when things look fine — they don't manufacture problems that don't exist.
Direct stocks use company-level data. ETFs are broken down using fund holdings data weighted by your position size, so the exposure view reflects what you actually own across every layer.