See what similar setups did next

Use Bullish Trade anywhere
Keep the same portfolio-strength workflow on desktop, mobile, and web. Choose the setup that fits how you invest.


Why use this Bullish Trade workflow
We show the actual distribution — including the setups that failed or went nowhere.
Simple and Fast for quick reads, or All Signals for deeper conviction before sizing up.
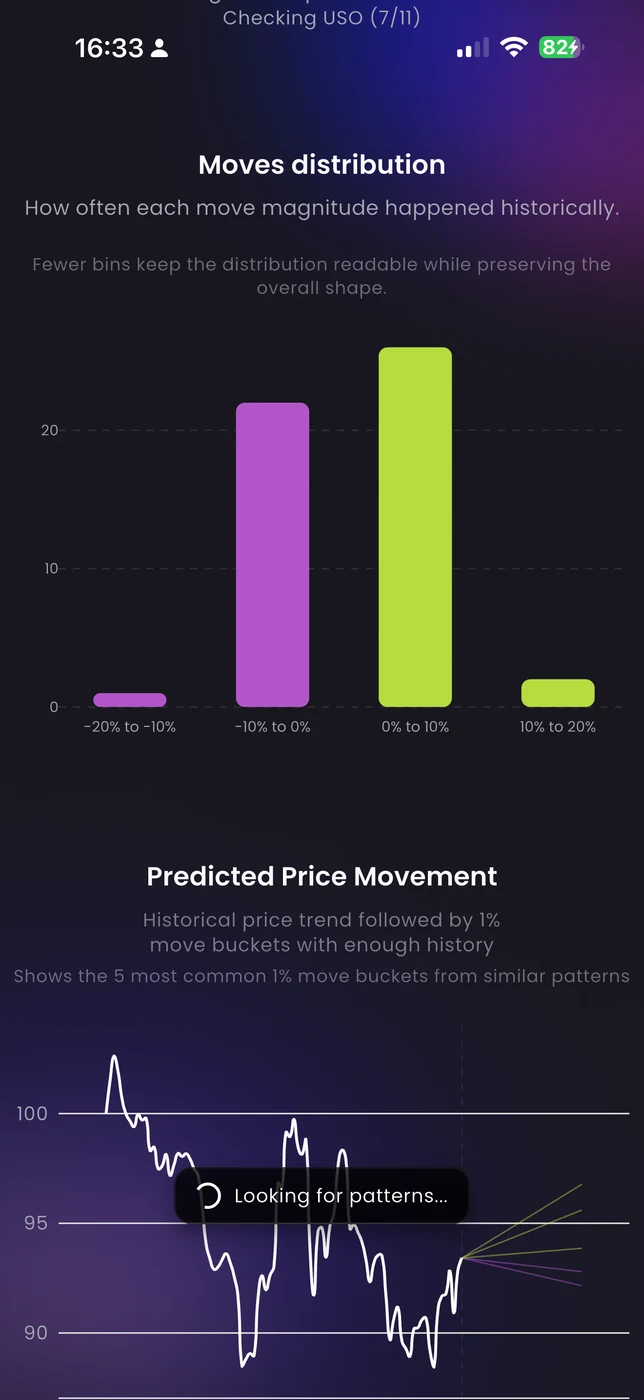
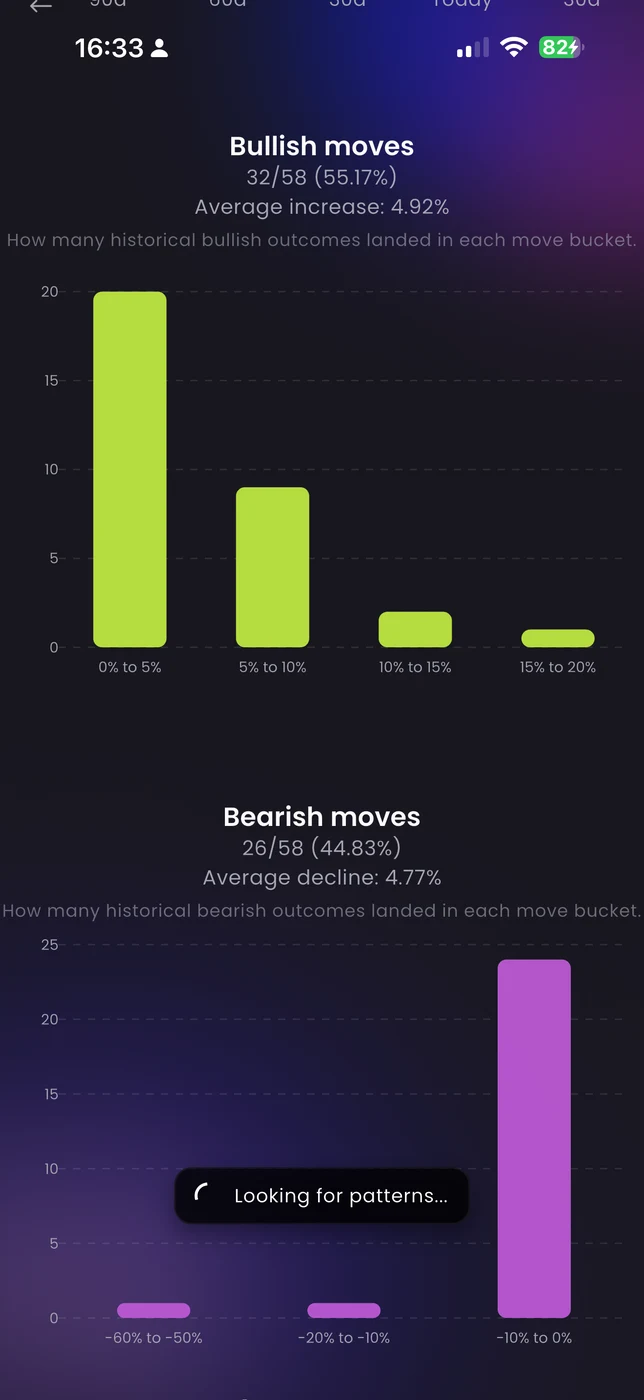
Bullish and bearish counts plus move distribution keep the tool honest.
This has happened before. Here's what followed.
Every interesting chart setup has historical precedent somewhere in the market. The pattern matching workflow starts with the current ticker and the recent price structure, then searches for the closest historical analogs.
That lets you ask a practical question before your next decision: where has the market seen a shape like this before — and what happened next?
Fast scan or deep scan
A quick closing-price comparison tells you if the shape rhymes. A deeper scan including indicators and volume tells you if the full context matches. Both are useful — for different decisions.
Simple and Fast, Precise and Fast, Key Signals, and All Signals. Use faster modes for quick directional reads and deeper ones when you need real conviction before sizing up.
A quick match can point you in the right direction. A precise one tells you whether it’s actually tradable. Start fast. Then validate before committing.
Real examples, not a black-box score
Knowing a setup is "about 87% similar to historical patterns" is meaningless without seeing the actual historical examples. The results surface the strongest concrete matches so you can review and judge relevance yourself.
If the matches feel genuinely similar to what you're looking at, weight the outcome data accordingly. If they feel forced, treat the result with appropriate skepticism.
A percentage won’t tell you if the match is real. Check the charts yourself. If the analogs look right, lean in. If they don’t, ignore the signal.
Full distribution — not just the best case
Pattern matching is only honest when it shows the complete picture: bullish count, bearish count, average move sizes for each direction, and the full distribution. Showing only the optimistic cases is selection bias dressed up as analysis.
See how the strongest analogs actually developed after the matching period — real price paths from real matches, not model projections.
A valid signal includes the full spread of results — not just optimistic scenarios. Inspect how matched setups evolved over time using actual price paths, not simulated projections.

Most useful before entries, exits, and sizing
Use pattern matching when you're considering an entry, managing a live position, or deciding whether to add to a winner or take some off. It's built for moments of uncertainty — not for post-trade confirmation.
It works best as one input alongside fundamentals and portfolio exposure — not as a standalone trigger.

From screens to clearer decisions
Load the ticker, choose how deep to scan, review the strongest historical matches, and use the outcome distribution to frame your next decision.
Start with the ticker and the recent setup you want to understand better.
Pick between faster closing-price scans and deeper indicator-driven searches.
Inspect the strongest historical analogs — actual examples, not just a score.
Use bullish/bearish counts, move distribution, and scenario paths to frame probabilities.
Pattern matching — common questions
How it works, how to read the results, and where the limits are.
The scan focuses on the recent price structure — roughly the last 40 trading days — and searches for historical setups with similar shape and signal characteristics depending on the analysis mode you choose.
Simple and Fast uses closing prices for shape comparison. Precise and Fast adds more constraints. Key Signals includes selected indicators. All Signals adds moving averages, RSI, and volume. Use faster modes for quick reads and deeper ones when conviction matters.
Look at bullish vs bearish counts, average move sizes, and scenario projections as probability frames — not forecasts. A 60% bullish match rate still means 40% of similar setups went the other way.
No. Historical pattern matching shows what comparable setups have done in the past. It improves your judgment — it doesn't remove uncertainty or replace risk management.